The Cycle for shop floor Improvement With Data Utilization
Improving productivity, quality, and energy efficiency by utilizing shop floor data to find the key to solving production issues and promoting improvements
Targets Setting
What is the issue? What is the current status? What needs to be solved?
POINTS
Clarify what issues should be solved.
Identify managerial issues
Productivity improvement
Quality improvement
Energy saving & conservation
Break down the issues
Break down each managerial issue into more specific shop floor issues for which solutions can be devised.
Application of data collection/analysis solutions
➊ Data collection
What kind of data should be collected and how?
POINTS
Select and collect data based on knowledge in equipment and production processes.
Factor analysis, data selection, and data collection
Select, collect, and accumulate the data necessary for solving the shop floor issues based on the engineer’s wealth of experience, intuition, and knowledge.
❷ Visualization
Visualization of collected data and confirmation of the effectiveness of improvements
POINTS
Quantify the current situation and gain awareness.
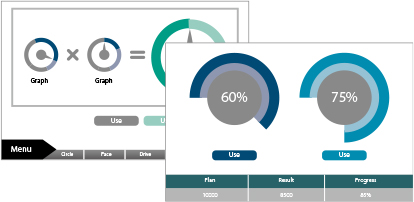
Data visualization
Display the collected data in an easily viewable format, to provide a visual indication of the status of the shop floor.
➌ Analysis
Factor analysis from collected data
POINTS
Find the factors necessary for improving the shop floor and solving issues.
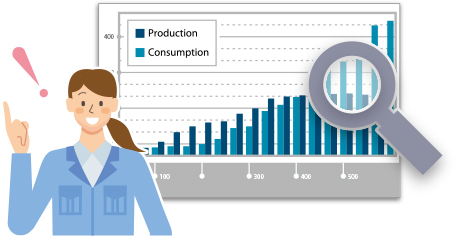
Data analysis
Use the collected data to analyze problem-solving factors.
➍ Diagnosis
Data diagnosis based on the analysis results
POINTS
Evaluate the improvements made and issues solved and create a continuous cycle for improvements.
Improvements using a diagnostic system
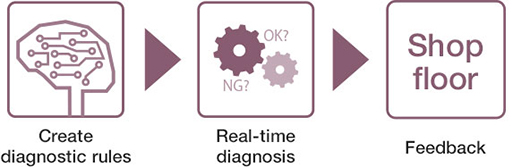
Create diagnostic rules based on the analysis results, diagnose the collected data in real time, and provide the shop floor with feedback.
Cases
Case 01
Data collection
Collecting data from the old type of Mitsubishi Electric PLC or other vendor's PLC
Case 02
Data collection
Utilizing the data from the PLC with an IT system
Case 03
Data collection
Collecting highly precise data to improve the accuracy of analysis
Case 04
Data collection
Visualization
Using the collected data in reports
Case 05
Visualization
Visualizing logging data easily
Case 06
Visualization
Checking the collected data at the shop floor
Case 07
Visualization
Checking the status of equipment on the shop floor from an office or a remote location
Case 08
Visualization
Analysis
Analyzing the cause to resolve the recurring error permanently
Case 09
Visualization
Analysis
Diagnosis
Analyzing energy savings from power consumption and production volume
Case 10
Visualization
Analysis
Diagnosis
Performing analysis and diagnosis with a PLC
Case 11
Analysis
Diagnosis
Using AI to create learning models for quality improvement and predictive maintenance
Case 12
Analysis
Diagnosis
Eliminating the performance gap between experts and inexperienced workers
Case 13
Diagnosis
Conducting predictive maintenance on equipment by diagnosing vibration data