
Factory Automation
Products
Software Solutions
- MELSOFT Gemini 3D Simulator
- MELSOFT VIXIO Visual Inspection Software
- ICONICS Solution Suite
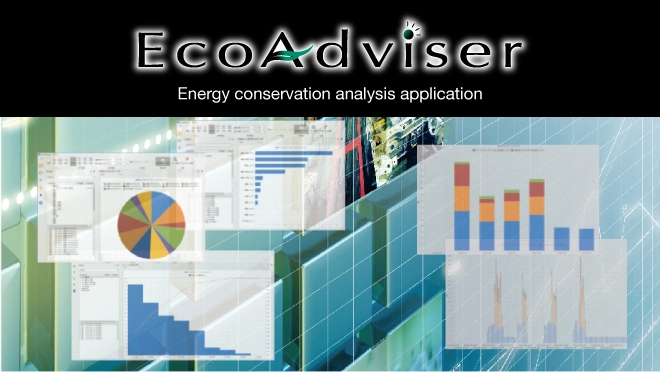
- EcoAdvisor Energy Saving Support Software
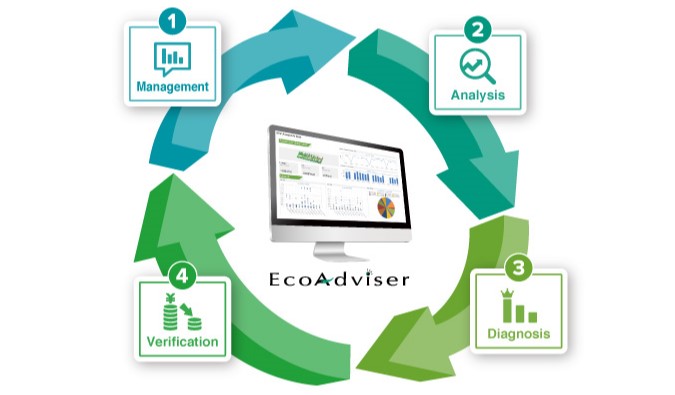
Supporting activities range from management to the reduction of CO₂ emissions and energy use

Management of CO₂ emissions and energy use
Centralized management of data on electricity, water, air, gas, heavy oil, and more!
Management available even with limited function edition.
Analysis of causes of energy loss
Our proprietary AI technology can be used to automatically extract energy losses! Support provided by AI diagnosis edition after analysis.

Diagnosis of energy loss factors
Verification of effectiveness of energy conservation measures
Energy Saving Support Software EcoAdviser Introduction
1. Management: Visualization of CO₂ emissions and energy use
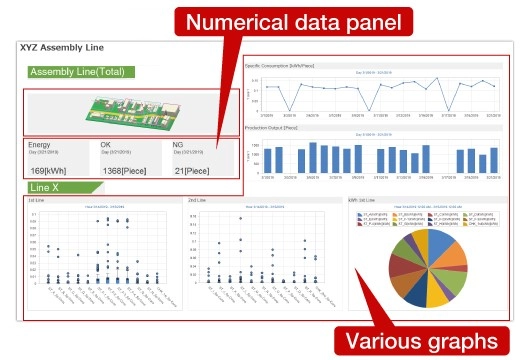
Keep track of energy using an extensive range of graphs. EcoAdviser makes it much more efficient to conduct energy conservation activities like creating reports and various daily tasks that had previously been completed using spreadsheet software. It also leverages visualization to assist with initiatives implemented at workplaces, and can help raise awareness by boosting understanding.
Creating dashboards is an effective way to highlight information to company members!
- Identify CO₂ emissions and energy use by each department and process
- Understand areas of improvement in energy conservation, etc.
- Make dashboard easily by putting graphs and results of energy-loss factor diagnosis on it
- Show the dashboard at the production site to improve the energy saving awareness of the employees.
Screen designs can be created at will for each customer!
2. Analysis: Automatic extraction of energy loss at production facilities
Five key areas of energy conservation
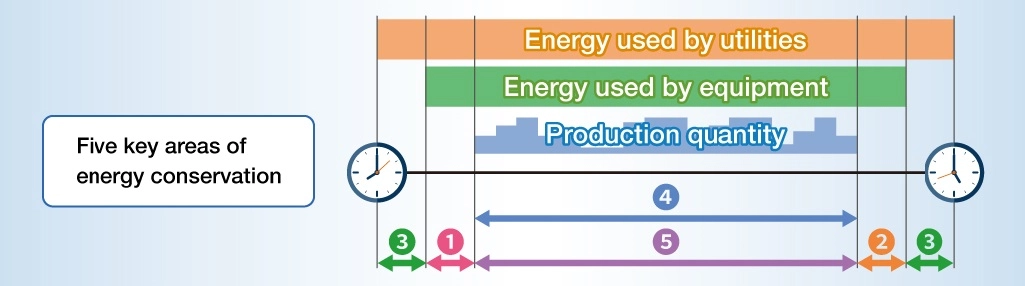
- Production equipment start-up to start of production time
- End of production to production equipment shutdown time
- Utilities* time loss:
・Utilities start-up to production equipment start-up time
・Production equipment shutdown to utilities shutdown time - Specific units from start of production to end of production
- Ratio of time with no production from start of production to end of production
* Auxiliary equipment that operates in tandem with production equipment (e.g., ventilation fans, mist collectors, compressors, etc.)
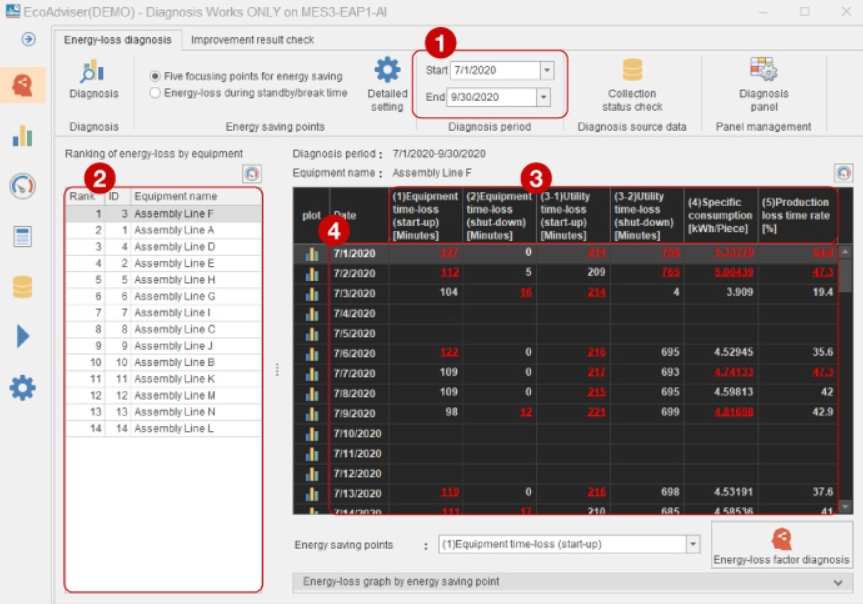
Energy Loss Diagnostic Screen
- Diagnosis period
Energy losses can be extracted by simply selecting the period for diagnosis. - Ranking display
Automatically ranks equipment in order of energy loss. - Five key areas of energy conservation
Energy loss for each of the five key areas of energy conservation is displayed for each day. - Energy loss extraction screen
The energy loss time (unit: minutes), specific unit requirement, and ratio of production loss time for each day are displayed on a single screen, with the worst day highlighted.
3. Diagnosis: Energy loss factors
What is energy loss factor diagnosis?
This refers to items that are closely associated with days when energy losses are greater than normal.
Factors closely correlating with energy loss such as date and time, equipment and so on are prioritized in terms of potential for reducing losses through recommended countermeasures.
| Diagnosis results | Measures based on results of diagnosis |
|---|---|
| Monday | Revise the start-up/shutdown times of the associated equipment at the start of the week. |
| Start-up 6 AM | Remind employees not to start-up equipment unnecessarily early in the morning. |
| 250 units produced on the day | Revise the production plan, as losses are higher on days with low production quantity. |
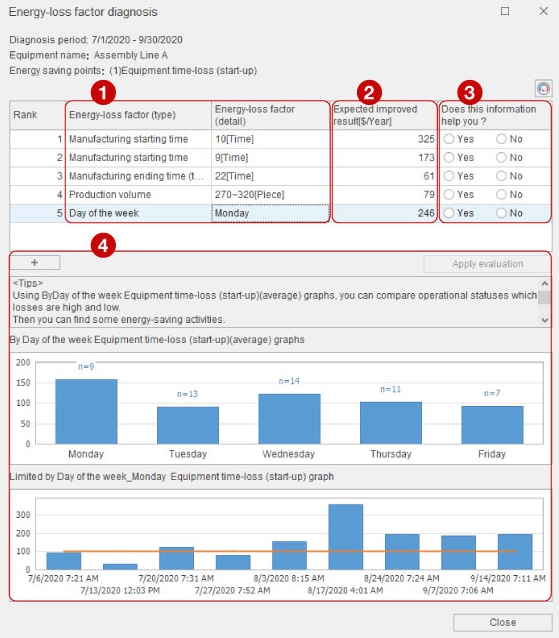
Energy Loss Factor Diagnosis Screen
- Diagnosis of energy loss factors
Factors that are closely correlated with energy loss are automatically identified and ranked using AI (day of the week, start-up time, production quantity, etc.). - Effects of expected improvement
The estimated improvement effect is automatically calculated and displayed in monetary terms. - Evaluation of diagnosis results
User evaluations are reflected in the results of subsequent diagnoses. Evaluations are ranked higher if they are useful, and are displayed higher in the list. - Presentation of advice
Comments and graphs that could be useful for improvements are presented.
4. Verification: Effectiveness of energy conservation measures
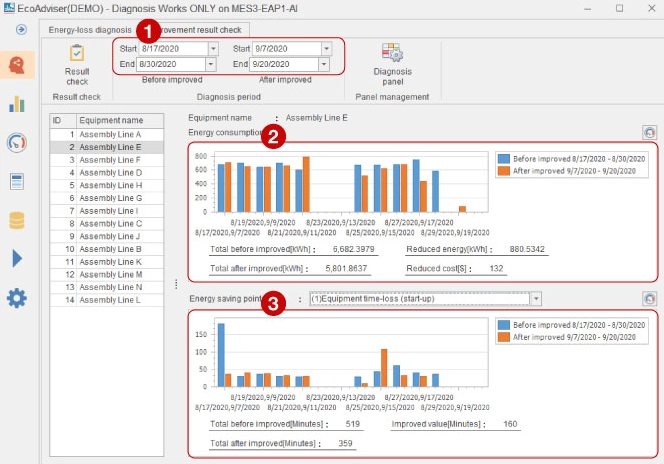
Before/After Energy Conservation Measures Effectiveness Verification Screen
- Diagnosis period
Effectiveness can be verified by simply selecting the period before and after the improvements were made. - Effects of improvements on the amount of electricity usage and the reduction in electricity charges
Comparisons can be made on an electricity usage and monetary basis. - Effects of improvement from an energy conservation perspective
The energy loss of selected energy conservation perspectives can be compared.
Product Line-up
Limited function edition
Energy conservation analysis application
Graphs and reports for analysis purposes can be created based on collected data, to better understand the current conditions.
Main Functions:
- Create analysis graphs
- Create dashboard
- Create forms
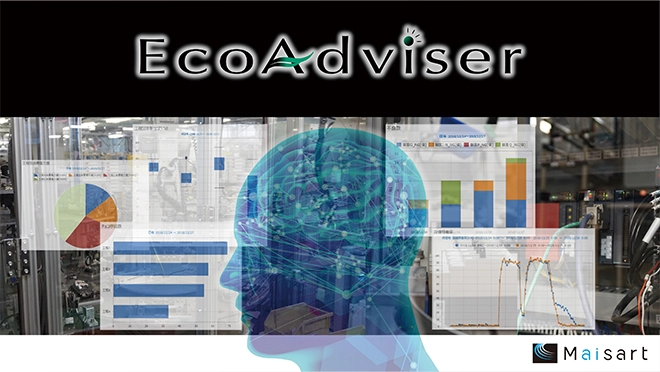
AI diagnosis edition
Energy conservation analysis and diagnosis application
In addition to visualization of collected data, effective energy conservation activities can be achieved with energy loss extraction and factor diagnosis using AI.
Main Functions:
- Create analysis graphs
- Create dashboard
- Create forms
- Extract energy loss
- Diagnose energy loss factors
- Verification of effectiveness of energy conservation measures
Case Studies
Centralized Precision Machine Management with ICONICS SCADA Software
EcoAdviser, in conjunction with ICONICS SCADA software, enables centralized and precise machine management. ICONICS SCADA software collects and monitors real-time data from sensors and components attached to machines, including energy consumption and production volumes.
EcoAdviser then analyzes this data, providing users with valuable insights that can serve as the first step in energy-saving activities.
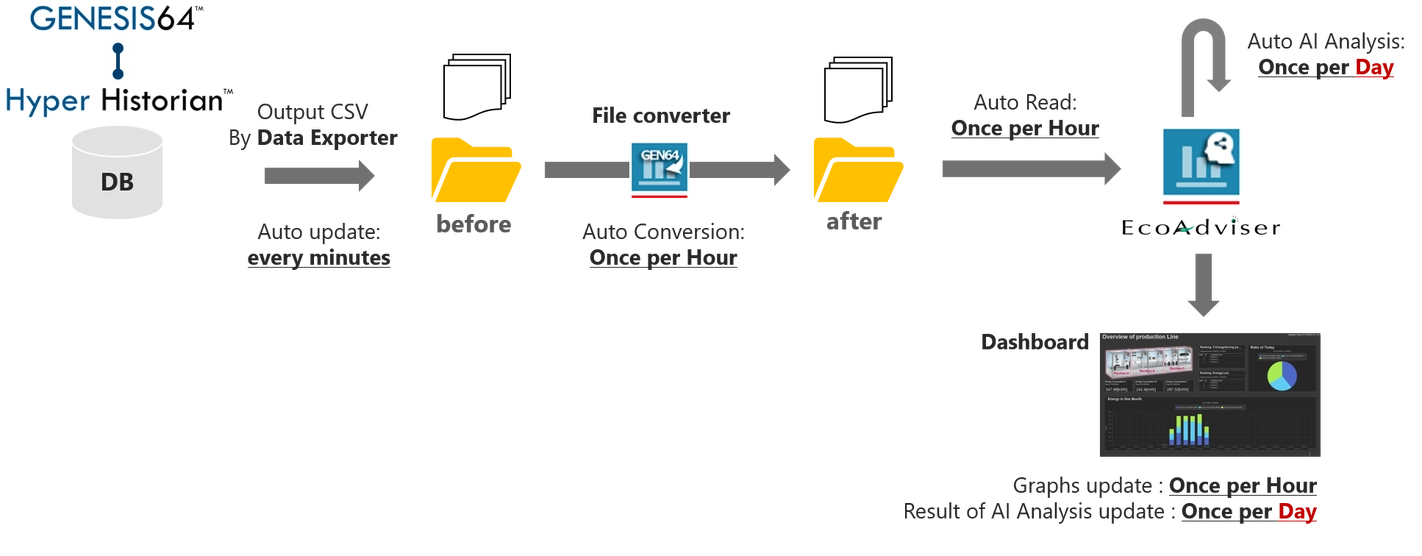
Conversion software connects ICONICS and EcoAdviser
The conversion tool automatically converts the latest measurement data output from GENESIS64 into a format that can be collected by EcoAdviser. Data is output from GENESIS64 and converted using this software without any user input required.
Additionally, this software converts past measurement data output from GENESIS64 into a format that can be collected by EcoAdviser.
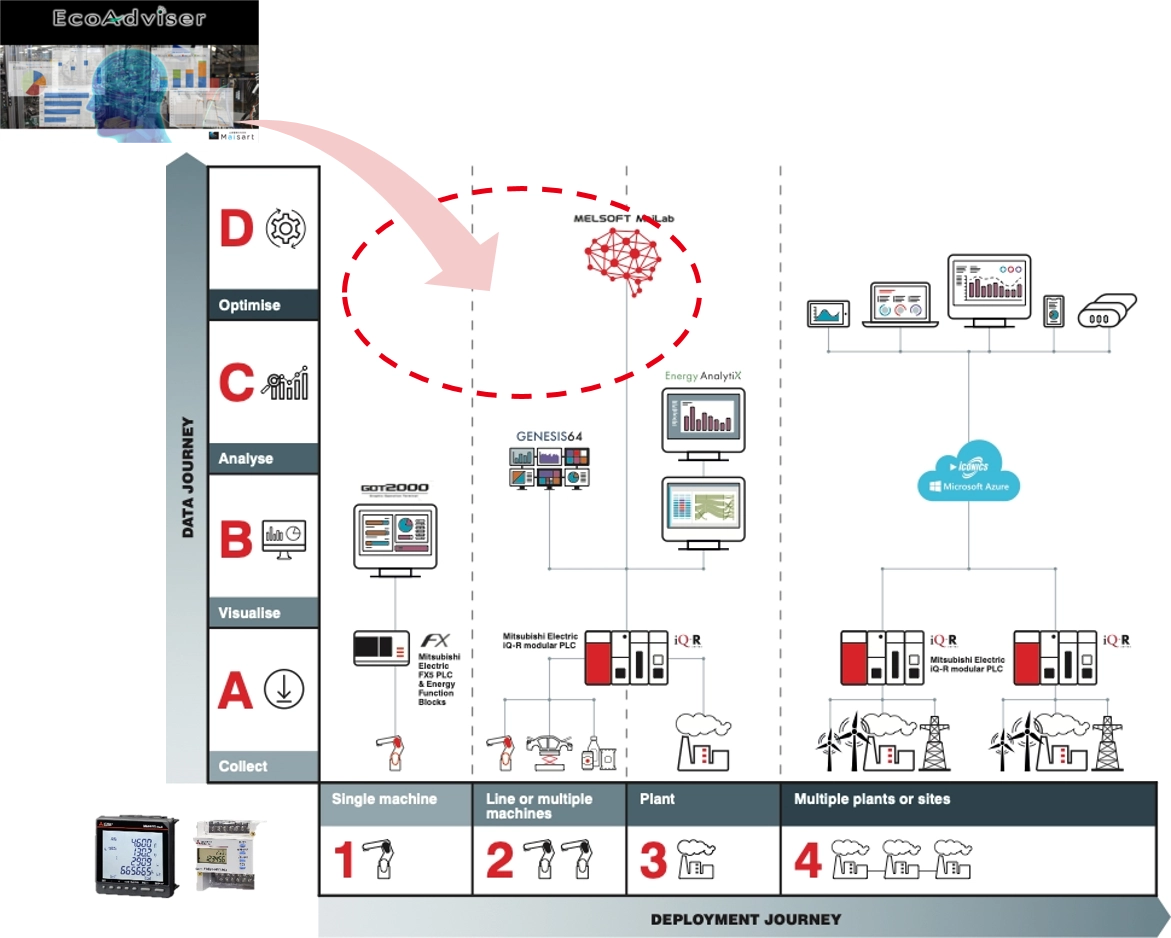
New step on Smart Manufacturing Kaizen Level
Integrated Energy Management Solutions
At Mitsubishi Electric, we offer advanced Energy Meters and our powerful EcoAdviser software. However, we believe that providing standalone components isn’t enough to meet the complex needs of modern energy management.
Our Proposal: An Integrated System
Rather than offering separate components, we propose a comprehensive “integrated system” that seamlessly combines our energy solutions. By integrating with ICONICS, we can deliver a robust system for energy monitoring and analysis.
Unlocking New Possibilities
We are dedicated to exploring new opportunities for energy management solutions using EcoAdviser. Our goal is to help businesses optimize their energy usage, reduce CO2 emissions, and achieve their sustainability targets through innovative, integrated systems.
Download
- Home
- Products
- Software Solutions
- EcoAdvisor Energy Saving Support Software